This past weekend Ludum Dare 26 took place. For those of you who don’t know, Ludum Dare is an online 48-hour game making competition. I wasn’t able to participate this time around so instead I took a little time to analyze the results of Ludum Dares 23, 24, and 25. I wanted to understand more about the most successful games so I compiled data on the top 200 games from the past three competitions.
Web FTW?
The first question I wanted to answer was to what extent is it important for an entry to be playable via the web? Intuitively it feels like games which can be played without downloading or installing anything would receive more plays and in turn higher reviews. To some extent the data bears this out, the majority of the top 200 games are web enabled:
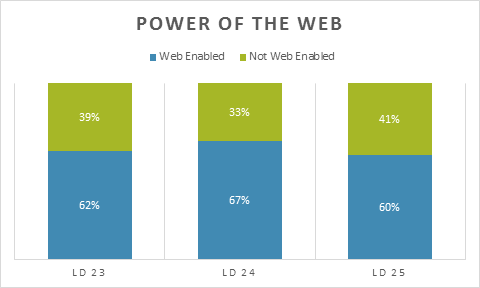
Web enabled entries represent roughly 60-70% of the top 200 for LD 23, 24, and 25. By contrast they make up 57% of all entries during those contests. Still, the difference is not as big as I expected which I take to mean that what technology you choose for Ludum Dare is not critically important to your entry’s success.
Is It All about Eye Candy?
Next I was curious to what extent players gave higher overall ratings for games which they felt were pretty. In my opinion, a prettier game is more likely to be downloaded. Players may also subconsciously bias their ratings in favor of prettier games. As a result I expected games with higher graphics or mood scores to have higher overall scores, too. Once again I looked at the top 200 games for the past three LDs. This time I calculated the relationship between a given category and an entry’s overall score:
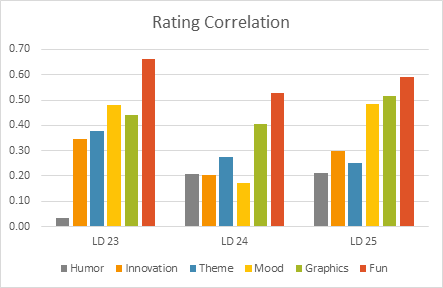
I used the Pearson function in Excel to determine the correlation coefficient for each rating and the overall score. Not surprisingly, games which were more fun and better looking tended to score higher. Somewhat more surprising, innovation did not appear to correlate strongly with the game’s overall score. So if you want to succeed in Ludum Dare it is likely better to spend your time on something tried and true which you can polish than on something innovative.
Grade Inflation?
Finally I wanted learn more about how people rate Ludum Dare games. I noticed that the overall score is not an average of the different ratings, but just how arbitrary is the overall score? For starters I found that players almost always assign a higher overall score than average. I’m not sure what this means in practice, but perhaps thinking concretely about a game’s graphics or humor leads players to rate a game more harshly than when remembering their feelings of playing the game:
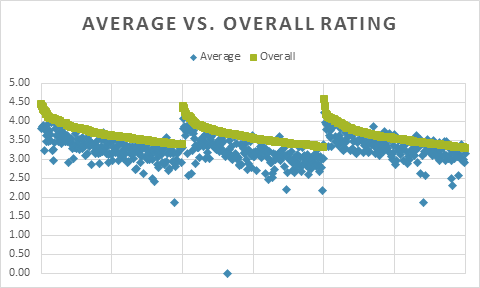
Nevertheless, I found the average rating correlates quite highly with the overall score. In fact it is roughly as correlated as the game’s fun rating. So while players may be inflating their overall score it shouldn’t have a big impact on the final results.
Conclusion
Ludum Dare is a treasure trove of useful information about game prototyping. When I started looking I expected to find that web based innovative games would rule the day. Instead, it appears that players prefer quality over novelty. In my opinion that’s just fine and suggests that the people playing and reviewing LD games are likely not so different from game players at large.
There’s so much more data available and I am a complete beginner when it comes to analyzing it or even thinking about what to look for. What types of things would you like to learn from Ludum Dare?